Archives for category: Uncategorized

Even with an El Nino and the wettest March on record, the prognosis of California’s drought is mixed. In Southern California, El Nino has been a disappointment, but parts of the state have been thoroughly drenched.

The Sierra Nevada snowpack, which provides almost 30% of water used in California, is at about 87% of it’s long-term average. An encouraging sign, but with climate affecting how the snowpack accumulates and melts, the Sierra Nevada snowpack is an unreliable source of water long-term.


image

Shasta Lake

 
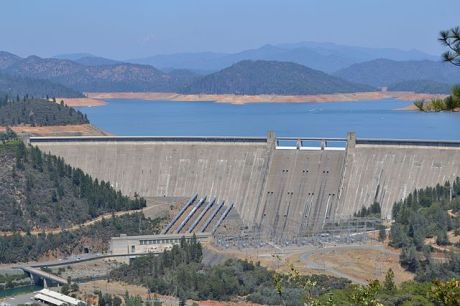
Reservoirs in Northern California are filling up, but smaller reservoirs in the southern part of the state remain at low levels. Lake Shasta, the state’s biggest reservoir and a key water supplier for the Central Valley, is just below historical average, and with recent storms, was filling up so fast that the Federal Bureau of Reclamation had to ramp up releases from 5,000 cubic feet per second to 20,000 cubic feet per second, the first time that the bureau has released water into the Sacramento River at such a rate since 2011.

Folsom Lake, another northern California Reservoir, is currently at 115% of it’s average, and as such, the San Juan water district has switched to a 10% voluntary conservation target, abandoning the state’s targets. Other water-rich districts have asked the state to ease conservation demands. This public perception of water abundance, at least in parts of the state, is not entirely accurate, and California’s drought and water usage is a statewide, not regional, issue. The US drought monitor shows much of central and southern California to be in an “exceptional drought.”

In fact, according to most experts, it will take years for California to rebound from this historic drought. The state’s groundwater aquifers have been heavily used during the drought, mostly by farmers drilling wells in the Central Valley. Water tables dropped by 50 feet in some areas, causing the land surface to sink which in turn leads to other problems, such as buckling roads. What’s more, Central Valley farmers pump water out of the ground faster than the aquifers can be replenished even in wet years. Although the state’s reservoirs are, on the whole, rebounding, many are still at levels far below their long-term averages. Moreover, drought is not only a meteorological condition, but is also when demand for water exceeds supply. California uses too much water, and conservation efforts are extremely important for the future, regardless of any El Nino.

On one unspecified day in February, the 200,000th electric car was sold in the state of California, which is home to about half of all electric cars in the United States. Governor Jerry Brown signed an executive order in March, 2012 establishing a path to 1.5 million zero emissions vehicles (ZEV) in California by the year 2020, and with new and improved electric cars available for purchase and ZEV-friendly codes and legislation, California is getting closer to it’s goal. Forecasts for EV growth vary significantly, from 5% of new car sales in 2020 according to the Ready, Set, Charge initiative and 15% of new car sales in the same period by the California Air Resources Board.

Image Link

Starting January 1st, 2017, the California Building Code has mandated that new commercial buildings supply a percentage EV Ready parking spots, ranging from four to ten percent of total parking spots, when parking exceeds ten spaces. All new residential construction must also be EV-ready. One- and two-family dwellings are required to have a service panel with the capacity for a 40-amp circuit (sufficient for a 32-amp charging station), and conduit that can support wiring for an 80-amp circuit. Residential developments with seventeen or more units must provide charging for three percent of all parking spaces.

There is currently one public charger for every ten electric vehicles, and while CalGreen’s updated building code addresses the need for EV-ready infrastructure in new construction, public charging stations are thin on the ground, and where they can be found, wildly inconsistent. The Public Utilities Commission (PUC) banned California’s electric utilities from owning and operating EV charging equipment, partly in the hopes that the private sector would produce more innovation. Another black cloud hanging over public charging stations for ZEV’s in California is that the PUC let NRG, an energy company sued by the state for misconduct, spend $100 million dollars on public charging for electric vehicles, essentially sticking a big chunk of public electric vehicle infrastructure in the middle of a lawsuit.

While policies favorable to ZEV’s are somewhat responsible for helping drive the growing number of electric vehicles on the road, the dropping price of electric car batteries is arguably the major driver of growth. The cost of Li-on battery packs fell an estimated $1000 per kilowatt hour between 2007 and 2014, and the cost currently hovers around $300 per kilowatt hour. Researchers generally agree that electric car batteries need to be less than $150/kWh to be able to compete with internal combustion vehicles.

The California Energy Commission (CEC) updates the Building Energy Efficiency Standards every three years, and 2016 is such a year, with all changes going into effect January 1, 2017. These standards are designed to achieve energy efficiency and improve indoor and outdoor air quality. The Building Energy Efficiency Standards cover new construction and construction on existing commercial and residential buildings in the state except for hospitals, nursing homes, and correctional facilities.

Image Link

These code updates are required by law and driven by new green building technologies and materials that continue to raise the bar for energy efficiency. The CEC updates and implements the building codes, which are then enforced by local city and county agencies. These standards must be cost-effective for homeowners in the long-term, and not just provide short-term energy savings. California is a huge, geographically diverse state, and the CEC recognizes that what is cost-effective in San Diego may not be in the Central Valley. The CEC divides California into sixteen climate zones, and the standards vary from zone to zone.

The updated standards will make it roughly $2,700 more expensive to build a new home, but these upfront costs are projected to generate an average of $7,400 in energy and maintenance costs over a thirty-year period. Compared to those built to the 2013 standards, single-family homes built to the 2016 standards will use 28% less energy.

The updated standards will not get California to it’s ultimate zero net energy goals, but it will bring the state significantly closer. In 2007, the CEC and Public Utilities Commission (PUC) publicly committed to the goal that all new residential construction will be zero net energy by 2020, and all new commercial construction will be zero net energy by 2030. The 2019 building standards, then, should be the final step in achieving zero net energy for residential construction in California.

The CEC’s Building Standards date back to 1977, and since then, have saved Californians over $74 billion in energy costs and are at least partially responsible for the state’s per capita electricity use staying flat over the last forty years, in stark contrast to much of the rest of the country.

There is no doubt that, in the green building industry, LEED sets the standard, but with the emergence of WELL, LEED is not the only four-letter certification available to green builders. The WELL Building Standard (WELL) is a performance-based system for measuring a building’s impact on human health and well-being. WELL is the first certification of its kind to focus entirely on the health and wellness of building occupants. Like LEED, there are different levels of WELL certification: Silver, Gold, and Platinum.

WELL sets performance requirements in seven categories relevant to occupant health:

Image Link

Air: Poor air quality can lead to asthma, allergies, and other upper respiratory illnesses, as well as Sick Building Syndrome (SBS), which is often characterized by headache and fatigue. WELL provides strategies to limit pollutant and contaminant concentrations. This is an area of significant overlap with LEED, which sets high standards for ventilation and indoor air quality.

Water: Clean drinking water is extremely important for human health. Over-reliance on bottled water is definitely bad for the environment, and most likely bad for human health. WELL mandates proper filtration technique and regular testing.

Nourishment: WELL provides design strategies to promote access to healthy food and to empower occupants to make healthy food choices.

Light: The circadian system regulates the physiological processes that control sleep, alertness, and digestion, and indoor lighting can have an extremely disruptive effect on the circadian system. WELL promotes indoor lighting that facilitates vision with minimal disruption to the circadian system.

Fitness: Lack of physical activity is a significant threat to human health, and WELL looks at factors in the built environment that encourage physical activity such as stair accessibility, neighborhood walkability, and another notable overlap with LEED, access to mass transit.

Comfort: WELL seeks to eliminate stressful distractions such as noise and olfactory pollution, while promoting acoustic, ergonomic, and thermal comfort to prevent stress and injury.

Mind: WELL promotes design strategies and workplace policies that contribute to occupants’ good mental health, from opportunities for altruism to providing a beautiful, pleasing environment.


WELL assesses the benefit of each WELL feature on the cardiovascular, digestive, endocrine, immune, integumentary, muscular, nervous, reproductive, respiratory, skeletal, and urinary systems. For example, stress, unhealthy diets, a lack of exercise and environmental pollutants can negatively affect cardiovascular health. Comfort features, such as sound-masking and optimal ergonomics, help reduce stress. Healthy diets, exercise, and elimination of environmental air pollutants also benefit cardiovascular health.

The Green Business Certification Organization (GBCI) provides third-party certification for both LEED and the WELL building standard, a collaboration between the Well Institute and GBCI to streamline the overlap between WELL and LEED and to further develop the connection between human health and wellness and sustainable design.


The solar power industry in Nevada experienced something of a rollercoaster this past December. The federal government, despite fears to the contrary, maintained the federal solar investment tax credit at 30 percent. Yet despite this vote of confidence in solar power from the federal government, the federal tax credit did not solve the regulatory battle over residential rooftop solar in the state of Nevada.

Image Link

Rooftop solar has been growing rapidly across the US, but particularly in Nevada, due to favorable geographical (lots of sun) and economic (favorable net metering policies) conditions. Nevada stood out as a particularly bright spot in a recent study of rooftop solar installations, with the number of installations quadrupling in Q2 of 2015. A 2014 state report found that net metering would save the state utilities 36 million dollars, and that Nevada solar users were, if anything, under compensated for the energy they returned to the grid.

And yet, Nevada recently made it much more expensive to be a residential rooftop solar power consumer. The Public Utilities Commission (PUC) raised the monthly charge for solar users from $12.75 a month to $17.90/month, with subsequent increases every three years for the next twelve years. The PUC also approved a two cent reduction in net-metering compensation, effectively requiring Nevada solar power users to put more money into the system and get less out of it.

Solar energy companies are fleeing the state. Immediately after the PUC’s decision, Solar City announced that they would completely cease operations in the state of Nevada, and a few weeks later, announced that they would eliminate 550 jobs, although some employees might get transferred to “business-friendly” states. Vivint and Sunrun are also leaving the state.

All of this, happening in a sunny state with incredible potential for solar energy, begs the question: why? A large utility in Arizona, another state with significant potential for solar power, is seeking permission to hike rates and reduce net metering credits. Across the country, utilities are fighting a coordinated battle against solar power.

The utilities are threatened, but going after solar is shortsighted. Instead of choosing to integrate renewable energy into the grid, Nevada Power and other utilities are choosing a path that makes it more cost effective for consumers to generate their own energy or at least fulfill most of their household energy needs through “behind the meter” resources, increasing costs for everyone on the grid. The utility rates are going up, but solar power and battery systems are getting cheaper.

Renewable energy, and rooftop solar in particular, is putting pressure on utilities. It is absolutely true that rooftop solar threatens the current business model, but the energy business is changing. Fighting against innovation isn’t going to help anyone.

A team at the University of Nottingham has developed an innovative test to measure the airtightness of buildings. The PULSE test determines the infiltration rate of cold air and the loss of heated air through gaps and cracks in a building, making it possible to create targeted strategies for eliminating drafts which in turn leads to greater energy efficiency and reduced heating bills. The PULSE test also illustrates when a building is too airtight, as too little ventilation can lead to poor indoor air quality.

Blower Door Test – Image Link

The PULSE test has been in development at the University of Nottingham for fourteen years and is now being commercialized as an more accurate and convenient alternative to the industry standard “blower door” technique. The PULSE test creates a low-pressure pulse throughout an entire building by releasing a short burst of air. The test takes a few seconds and creates minimal disruption for building occupants and construction workers. The PULSE test is also quick and easy enough for construction workers to perform several times before a building is complete.

In contrast, the “blower door” test takes fifteen to thirty minutes and is usually only used at the completion stage, making it difficult to implement any significant change based on the results of the test.

In a blower door test, a powerful fan mounted into the frame of an exterior door pulls air out of a building. This temporarily lowers the air pressure inside, leading to higher outside air pressure flowing in through all unsealed cracks and openings.

The blower door originated as a research tool in the early 1970’s, simultaneously invented by two groups independently studying the contribution of air leakage to heat loss in residential buildings. The first commercial blower door unit hit the market in 1980.

Regardless of which test is used, determining the airtightness of a building is a crucial step in any energy audit. For homeowners without access to professional equipment, it is possible to at least find leaks, if not measure them, by using a powerful box fan or even a fog machine.

Image Link

With the construction of every new building comes a big pile of construction and demolition waste. On an annual basis, the construction and demolition industry creates more waste than any other industry in the United States. The average new construction project creates 3.9 pounds of waste per square foot, and the average demolition project creates 155 pounds of waste per square foot. Construction and demolition waste is a major environmental concern, but fortunately, construction professionals have a wide range of strategies to eliminate, reduce, and reuse construction and demolition debris, helping the environment and hopefully saving some money along the way.

Most construction waste ends up in landfills, but an increasing amount of construction waste is being removed from the waste stream in a process called diversion. Diverted materials are sorted for recycling and reuse. Metal, cardboard, paper, plastics, carpeting, and many other materials can be recycled and reused, often to the builder’s financial benefit.

As with any waste-related problem, the first step is simply to create less waste. Moving away from temporary support systems and structures as much as possible is an incredibly important way to eliminate waste in the construction process, as these temporary supports usually cannot be salvaged and get thrown away at the end of a project. For example, a modular metal form system used during concrete construction can be easily unmounted and reused for another project, avoiding wood waste from the use of plywood and lumber formwork.

While most construction waste cannot be completely eliminated, it can be reduced in both the planning and construction phases. For example, designing a building to fit standard material sizes helps reduce material waste. Builders can work with material suppliers to select material that uses minimal packaging, or even set-up an agreement to buy back any unused materials. On the job, construction professionals can choose to salvage materials from demolition projects, limit the use of adhesives wherever possible, and chip branches and trees cleared from the site for use as mulch.

Deconstruction provides a greener alternative to demolition. Selective deconstruction, also known as soft-stripping, involves going into a building before demolition and removing high-value materials such as lighting fixtures, hardwood flooring, and solid interior doors. Whole house deconstruction includes soft-stripping but goes a step further in salvaging the materials that make up the structure of the building itself, such as bricks and framing lumber. Deconstruction requires more labor and may take longer to complete than demolition, but due to the fact that most deconstruction is run by non-profits, the tax-deductible value of the donated materials can make deconstruction cost-competitive with demolition.

The 2015 Paris Climate Conference, also known as COP 21, was a big, news-making event, with the world’s attention mostly focused on global leaders’ plans to reduce greenhouse gas emissions and the use of fossil fuels. But for the first time in the UNFCC’s conference history, green building had its day at the conference, too.


Image Source

Why talk about buildings at a conference about climate change? According to the United Nations Environment Programme (UNEP), buildings are responsible for more than 30% of greenhouse gas emissions, and if growth continues unchecked, emissions could double by 2050. The buildings sector has to reduce emissions by eighty-four gigatons, the emissions equivalent of 22,000 coal powered plants, by the year 2050 to do it’s part to keep the earth from warming to two degrees Celsius.

The buildings sector also offers one of the most cost-effective ways to reduce energy use and emissions, and many paths to success already exist but need to be refined or implemented on a larger scale. This makes green building one of the best ways for countries to achieve their Intended Nationally Determined Contributions (INDC’s), and forty countries have already specifically cited green building as one of the ways they can meet their INDC’s. Buildings also last a long time, and a new construction project will become the housing stock of the future. Building environmentally unfriendly today locks in problematic housing for tomorrow.

As part of the conference, the US Green Building Council (USGBC) announced that it plans to scale up to support the certification of more than five billion square feet of green building over the next five years with LEED and EDGE (Excellence in Design for Greater Efficiencies), a green building certification program for developing countries. The USGBC also committed to expanding worldwide educational resources for green building and to double non-English offerings.

All seventy-four national Green Building Councils support the commitment to achieve Net Zero carbon building and energy efficient refurbishment of existing housing stock by 2050. Twenty-five Green Building councils made the commitment to register, renovate, or certify 1.25 billion square meters of green building by 2020. And three national green building councils made the commitment to introduce Net Zero certification.


greywater

Greywater recycling systems first became legal in California in 1989, but with onerous permitting fees and red tape, few homeowners actually bothered to file for permits, choosing to work within the limited framework for greywater systems that didn’t require a permit, or working with plumbers who were willing to look the other way. In an effort to make greywater systems more feasible and attractive to more people, legislation passed in San Francisco, Marin, Santa Barbara, and other California counties has eliminated the permitting fee and inspection for homeowners seeking to build water recycling systems.[1]

Eliminating permit fees wouldn’t really hurt the state and local government revenue. Santa Barbara issued a mere ten greywater permits between 1989 and 2009. San Francisco has issued five permits for such systems since 2012. While there are no significant studies of greywater usage, anecdotal evidence from homeowners, plumbers, and greywater activists suggest that the actual number of greywater systems in use is much higher than that. Ecological systems engineer Art Ludwig estimates that 8,000 unpermitted greywater systems were built for every permit granted over the last twenty years based on data from a soap company study.[2]

Under current California law, greywater systems using water only from washing machines can be constructed in a single family home without a permit. These systems must have an easy way for water to flow back into the sewer or septic system, discharge greywater under a 2” inch cover of mulch, plastic, or stones, have a maintenance manual, and keep the water on the same property on which it is produced. Greywater systems using water from showers and bathroom sinks do, however, require a permit, except in the few California counties mentioned above. Kitchen greywater use is illegal California.

If greywater permitting restrictions haven’t stopped some enterprising Californians from going underground, what’s the problem? According to Art Ludwig and other greywater activists, the current regulations serve to dissuade professionals from taking on water recycling projects, leaving homeowners to figure it out themselves. According to Ludwig, “The current greywater regulation approach hinders best sustainability practices, and undermines respect for codes in general.”[3]

In the midst of it’s historic and unrelenting drought, California could stand to learn a thing or two from Australia’s response to the epic thirteen-year-drought known as “The Big Dry.” Two thirds of Australian homes have water-recycling systems, a significant contrast to the only thirteen percent of Californian homes currently using greywater systems.[4]

For more information visit Integrated Design 360.

[1] http://www.sfchronicle.com/72hour-sale-event/article/Gray-water-regulations-eased-under-S-F-6594457.php

[2] http://greywateraction.org/greywater-faq/

[3] http://oasisdesign.net/greywater/law/california/

[4] http://www.sfchronicle.com/news/article/Drought-survival-What-Australia-s-changes-can-6528480.php

Working Americans spend much as ninety percent of their time inside, making indoor air quality extremely important for worker health, and, according to a new study from the Harvard School of Public Health and SUNY Upstate Medical School, cognition and decision-making abilities.[1]Green buildings have a clear advantage over conventional buildings when it comes indoor air quality, and while previous studies have demonstrated a self-reported improvement in productivity in green buildings, this is the first study to demonstrate improved cognition in green buildings with subjects blind to the study conditions.

GreenAir

The study tracked twenty-four professionals over six workdays from 9 AM to 6 PM in an environmentally controlled office space where they received a standard cognitive assessment each day. On some days the participants were exposed to indoor air quality (IAQ) conditions representative of conventionally constructed buildings, with high volatile organic compound (VOC) levels, and on other days the participants worked in an office with simulated IAQ conditions representative of green buildings (low VOC concentration), both with the same ventilation rate. The study also looked at green buildings with improved ventilation, which they described as “Green +”.

The results are striking. Participants’ cognitive scores were 61% higher on the green building day and roughly double on the two Green + days than on the conventional building days. In other words, green buildings are significantly better and healthier work environments than conventional buildings.

There are many ways that green builders can improve indoor air quality, but the first step is to keep pollutants out by working with materials that do not release pollutants and chemicals at harmful levels. There are also LEED credits that address ventilation, filtration, and the prevention of cross-contamination.[2]

What, exactly, does human health and indoor air quality have to do with green buildings? Beyond reducing the use of chemicals that are good for neither the environment nor human beings, human health is an important piece of the sustainability puzzle. While the link between other green building initiatives such as reduced energy use and reduced waste output and environmental protection are more explicit, improved air quality – indoor and outdoor – is important for a sustainable future.

For Green Building Consulting Services contact www.IntegratedDesign360.com 

[1] http://ehp.niehs.nih.gov/wp-content/uploads/advpub/2015/10/ehp.1510037.acco.pdf

[2] http://www.usgbc.org/credits/eq11